|
||
|
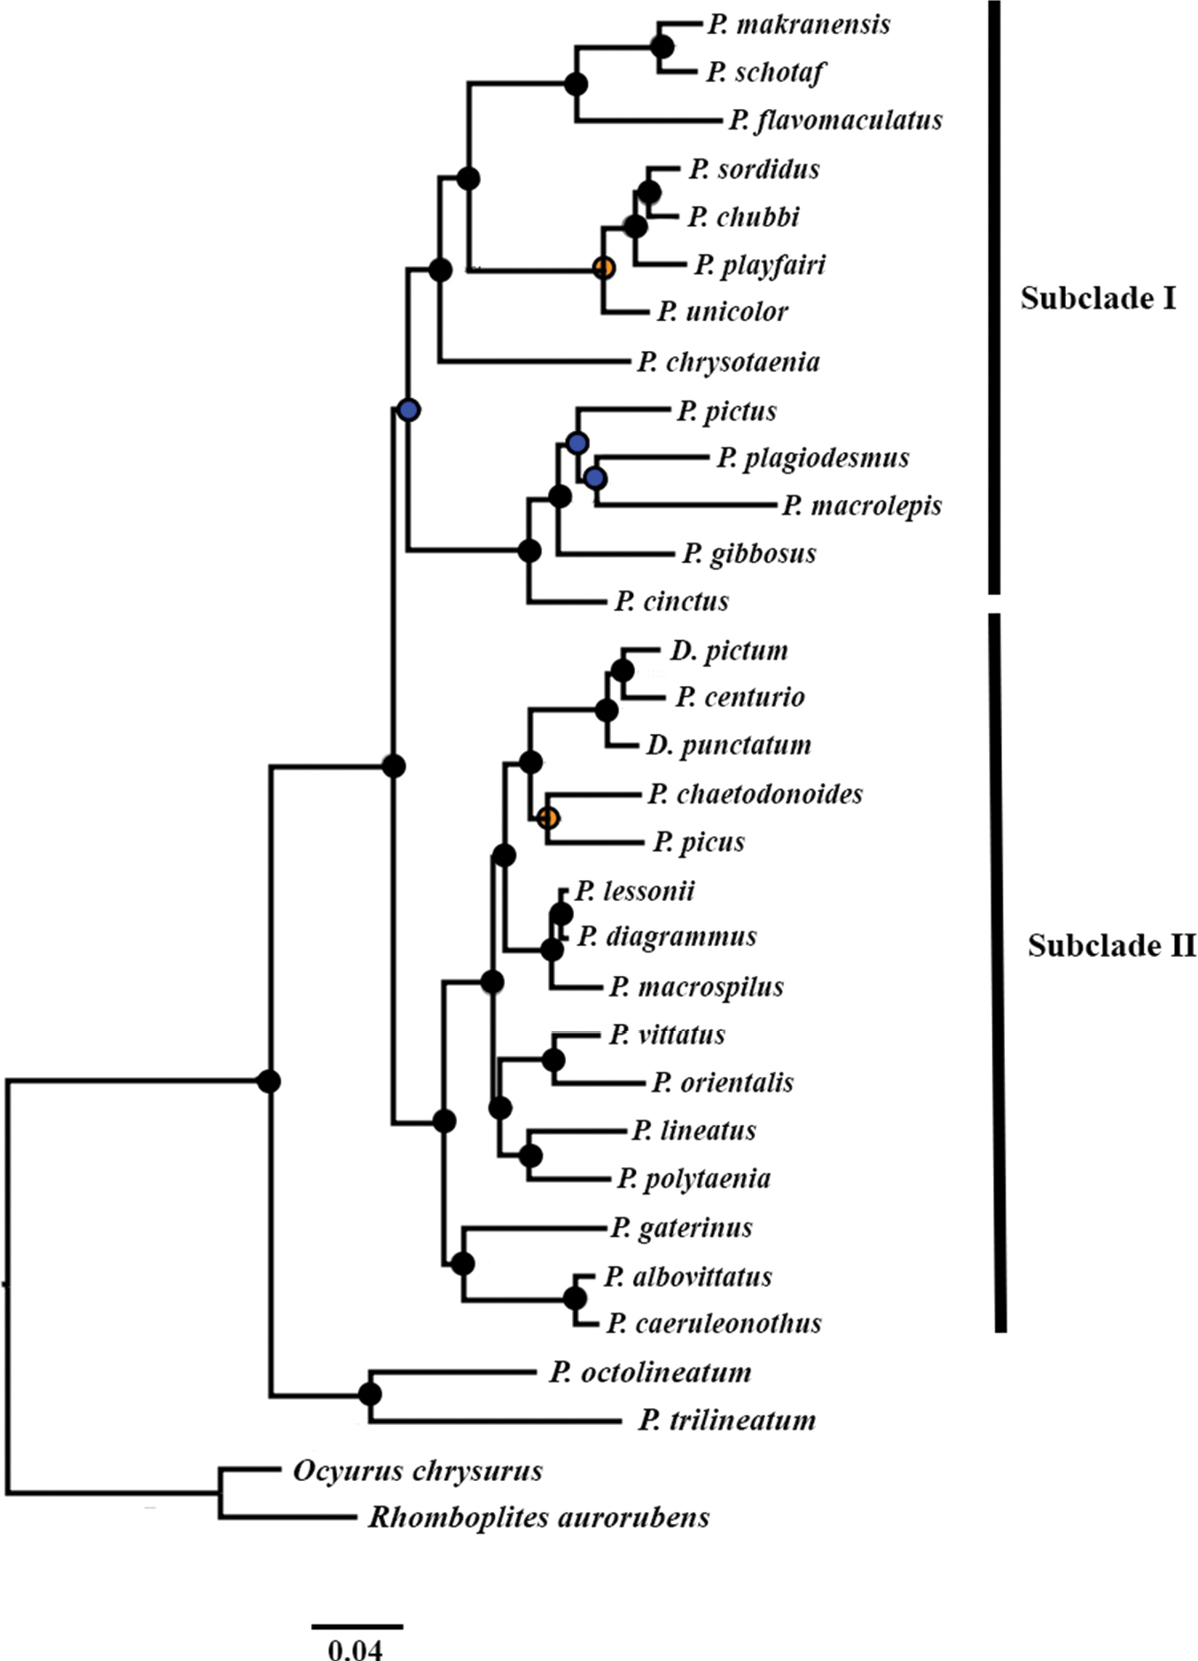
Phylogeny recovered by the Bayesian Inference (BI) and Maximum Likelihood (ML) analyses for the Cyt b, COI and RAG1 dataset. The black circles indicate nodes with supports (ML bootstrap BP ≥ 75% and BI probability PP ≥ 0.95), orange circles (BP ≤ 75% and BI PP ≥ 0.95) and blue circles (PP ≤ 0.95 and ML BP ≤ 75%). |