|
||
|
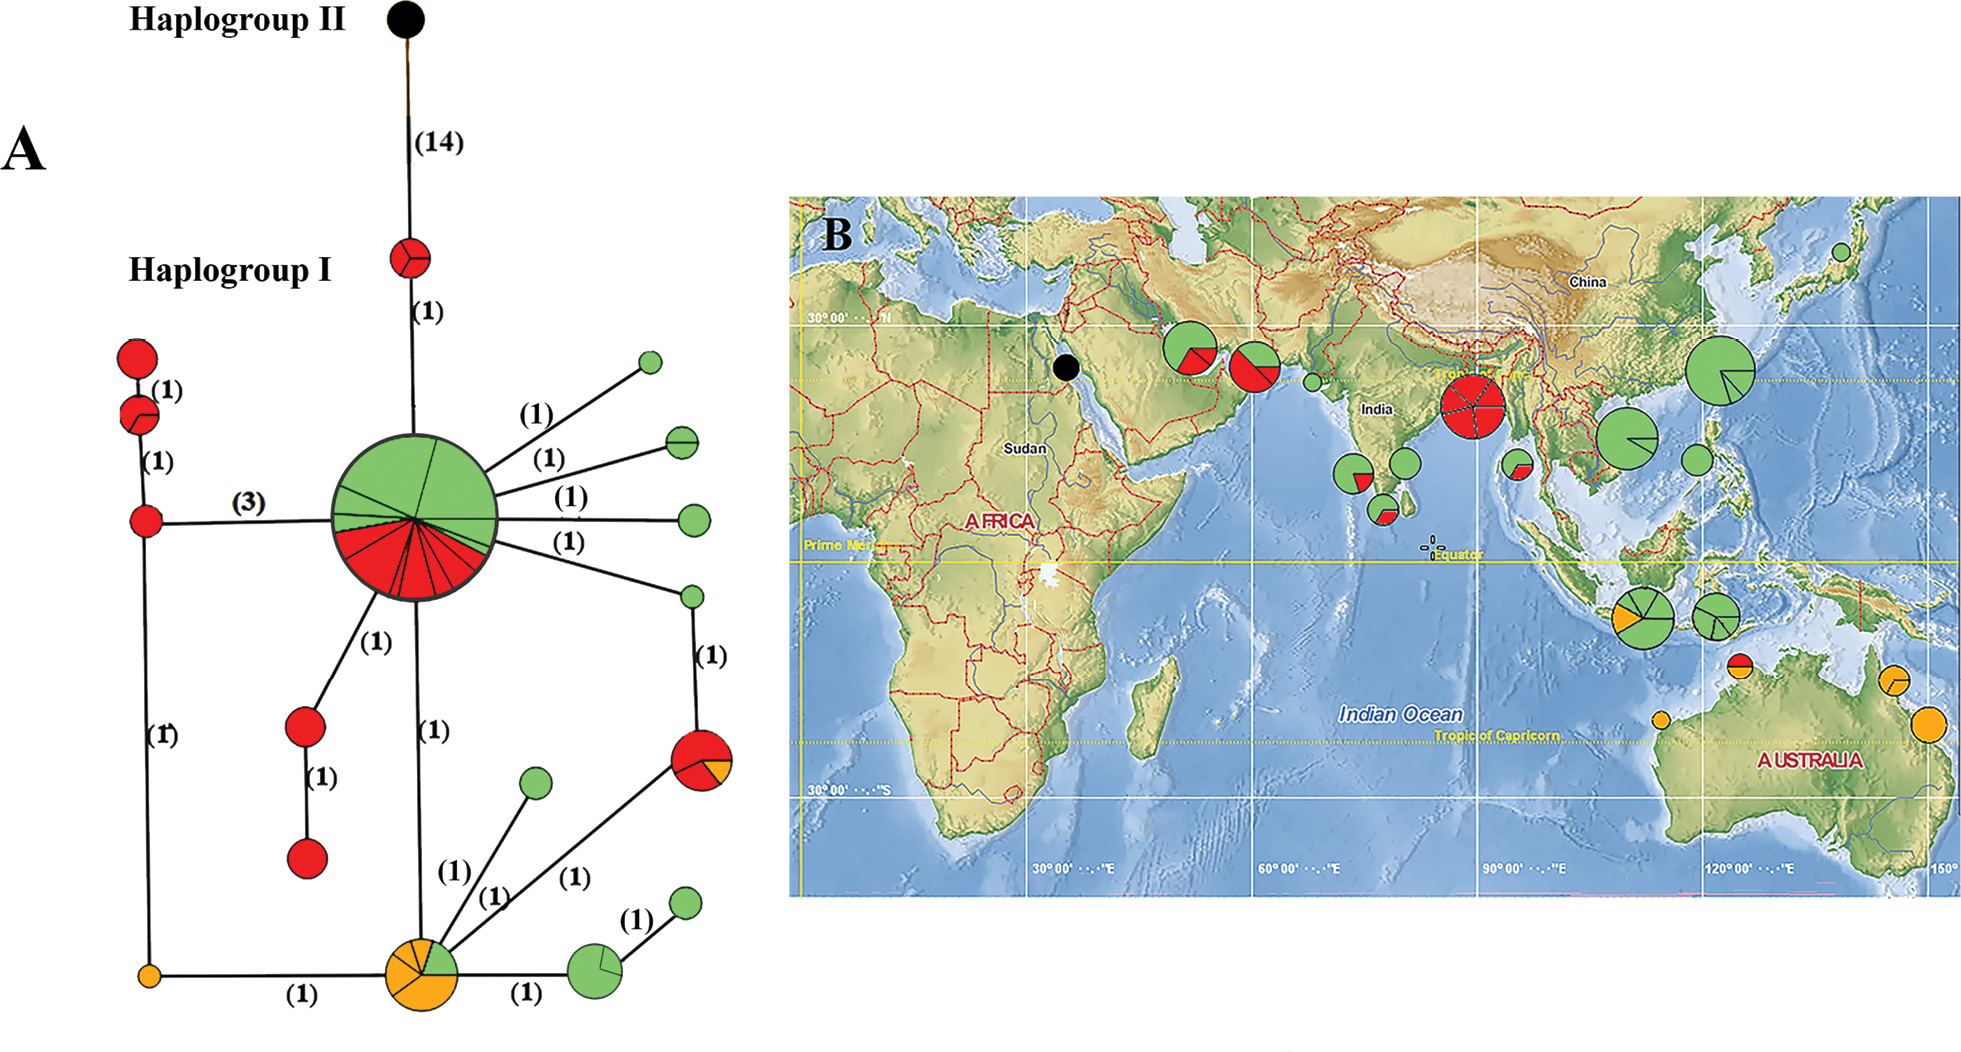
Median‐joining network obtained of 617 bp of mitochondrial COI for Diagramma species (A). Map depicting the geographical distribution of 17 haplotypes (B). Circle sizes are relative to haplotype frequency. Numbers between haplotypes represent mutational steps between haplotypes. Colour circles indicate species of D. pictum (red: Persian Gulf to Bangladesh, green: China and Indonesia) and D. labiosum (orange: Australia), D. punctatum (black: Red Sea). |