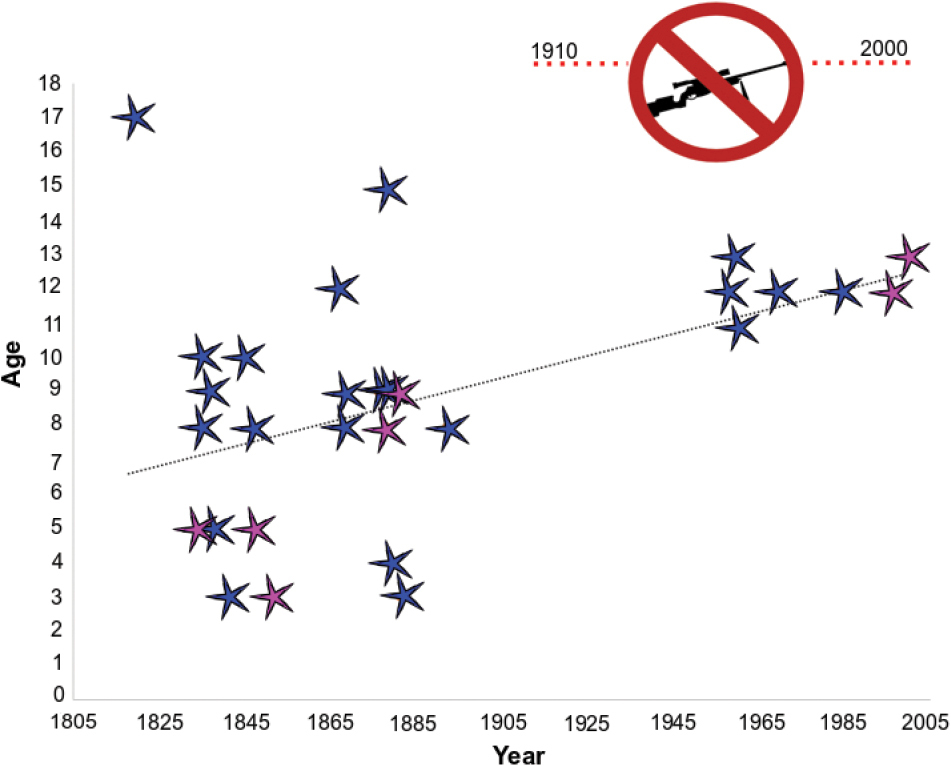
Scatter plot representation of museum specimen ages and year of collection over time with an emphasis on before and after the 1913 hunting ban (as indicated by the gun icon). The trend line is r2 = 0.21. Blue and purple stars are used for males and females, respectively.


  Part of: Forcina G, Woutersen K, Sánchez-Ramírez S, Angelone S, Crampe JP, Pérez JM, Fandos P, Granados JE, Jowers MJ (2021) Demography reveals populational expansion of a recently extinct Iberian ungulate. Zoosystematics and Evolution 97(1): 211-221. https://doi.org/10.3897/zse.97.61854