|
||
|
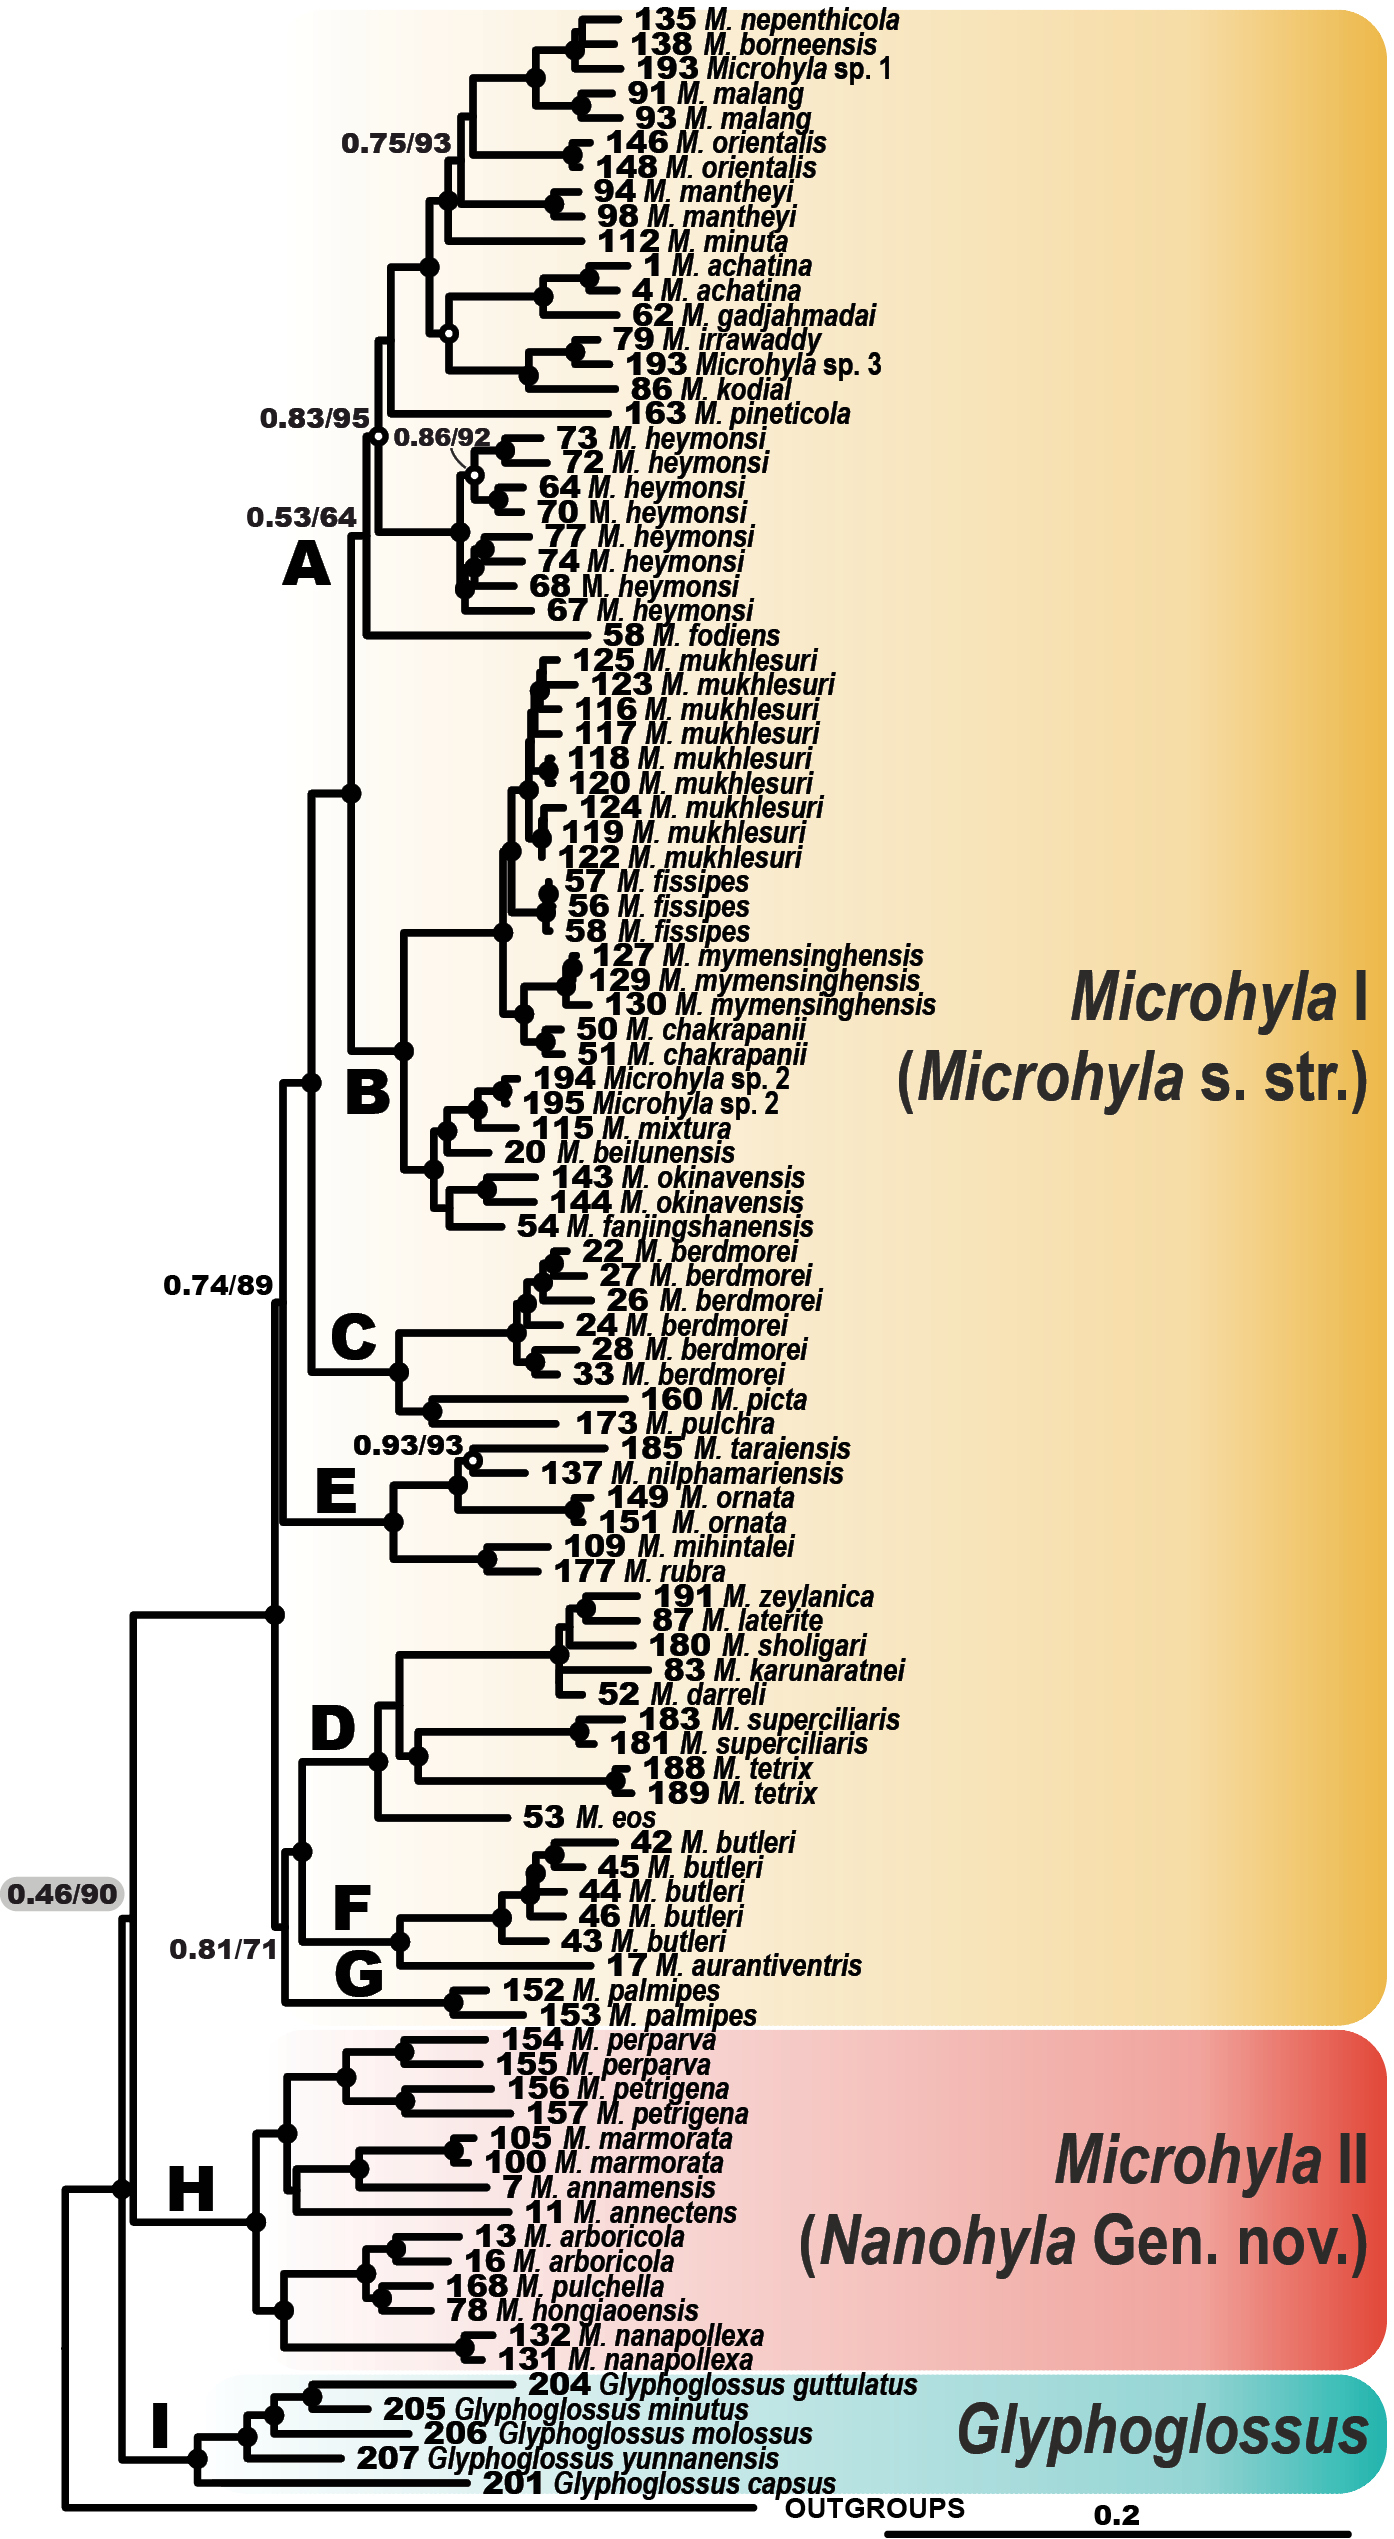
Bayesian inference tree of the Microhyla–Glyphoglossus assemblage derived from the combined mtDNA + nuDNA analysis of 3207 bp of alignment including 12S rRNA, tRNAVal, 16S rRNA and BDNF gene fragments. Black circles correspond to well-supported (PP ≥ 0.95; BS ≥ 90) and white circles to moderately supported (0.95 > PP ≥ 0.90; 90 > BS ≥ 75) nodes; no circles indicate unsupported nodes. Letters A–I denote the species groups of Gorin et al. (2020). For voucher specimen information and GenBank accession numbers see Suppl. material 1: Table S1. Yellow, red, and blue color denotes Microhyla I, Microhyla II, and Glyphoglossus, respectively. Numbers at tree nodes correspond to PP/BS support values, respectively (shown only for moderately supported nodes). For full version of this tree showing the outgroups and node support values see Suppl. material 6: Figure S1. |