|
||
|
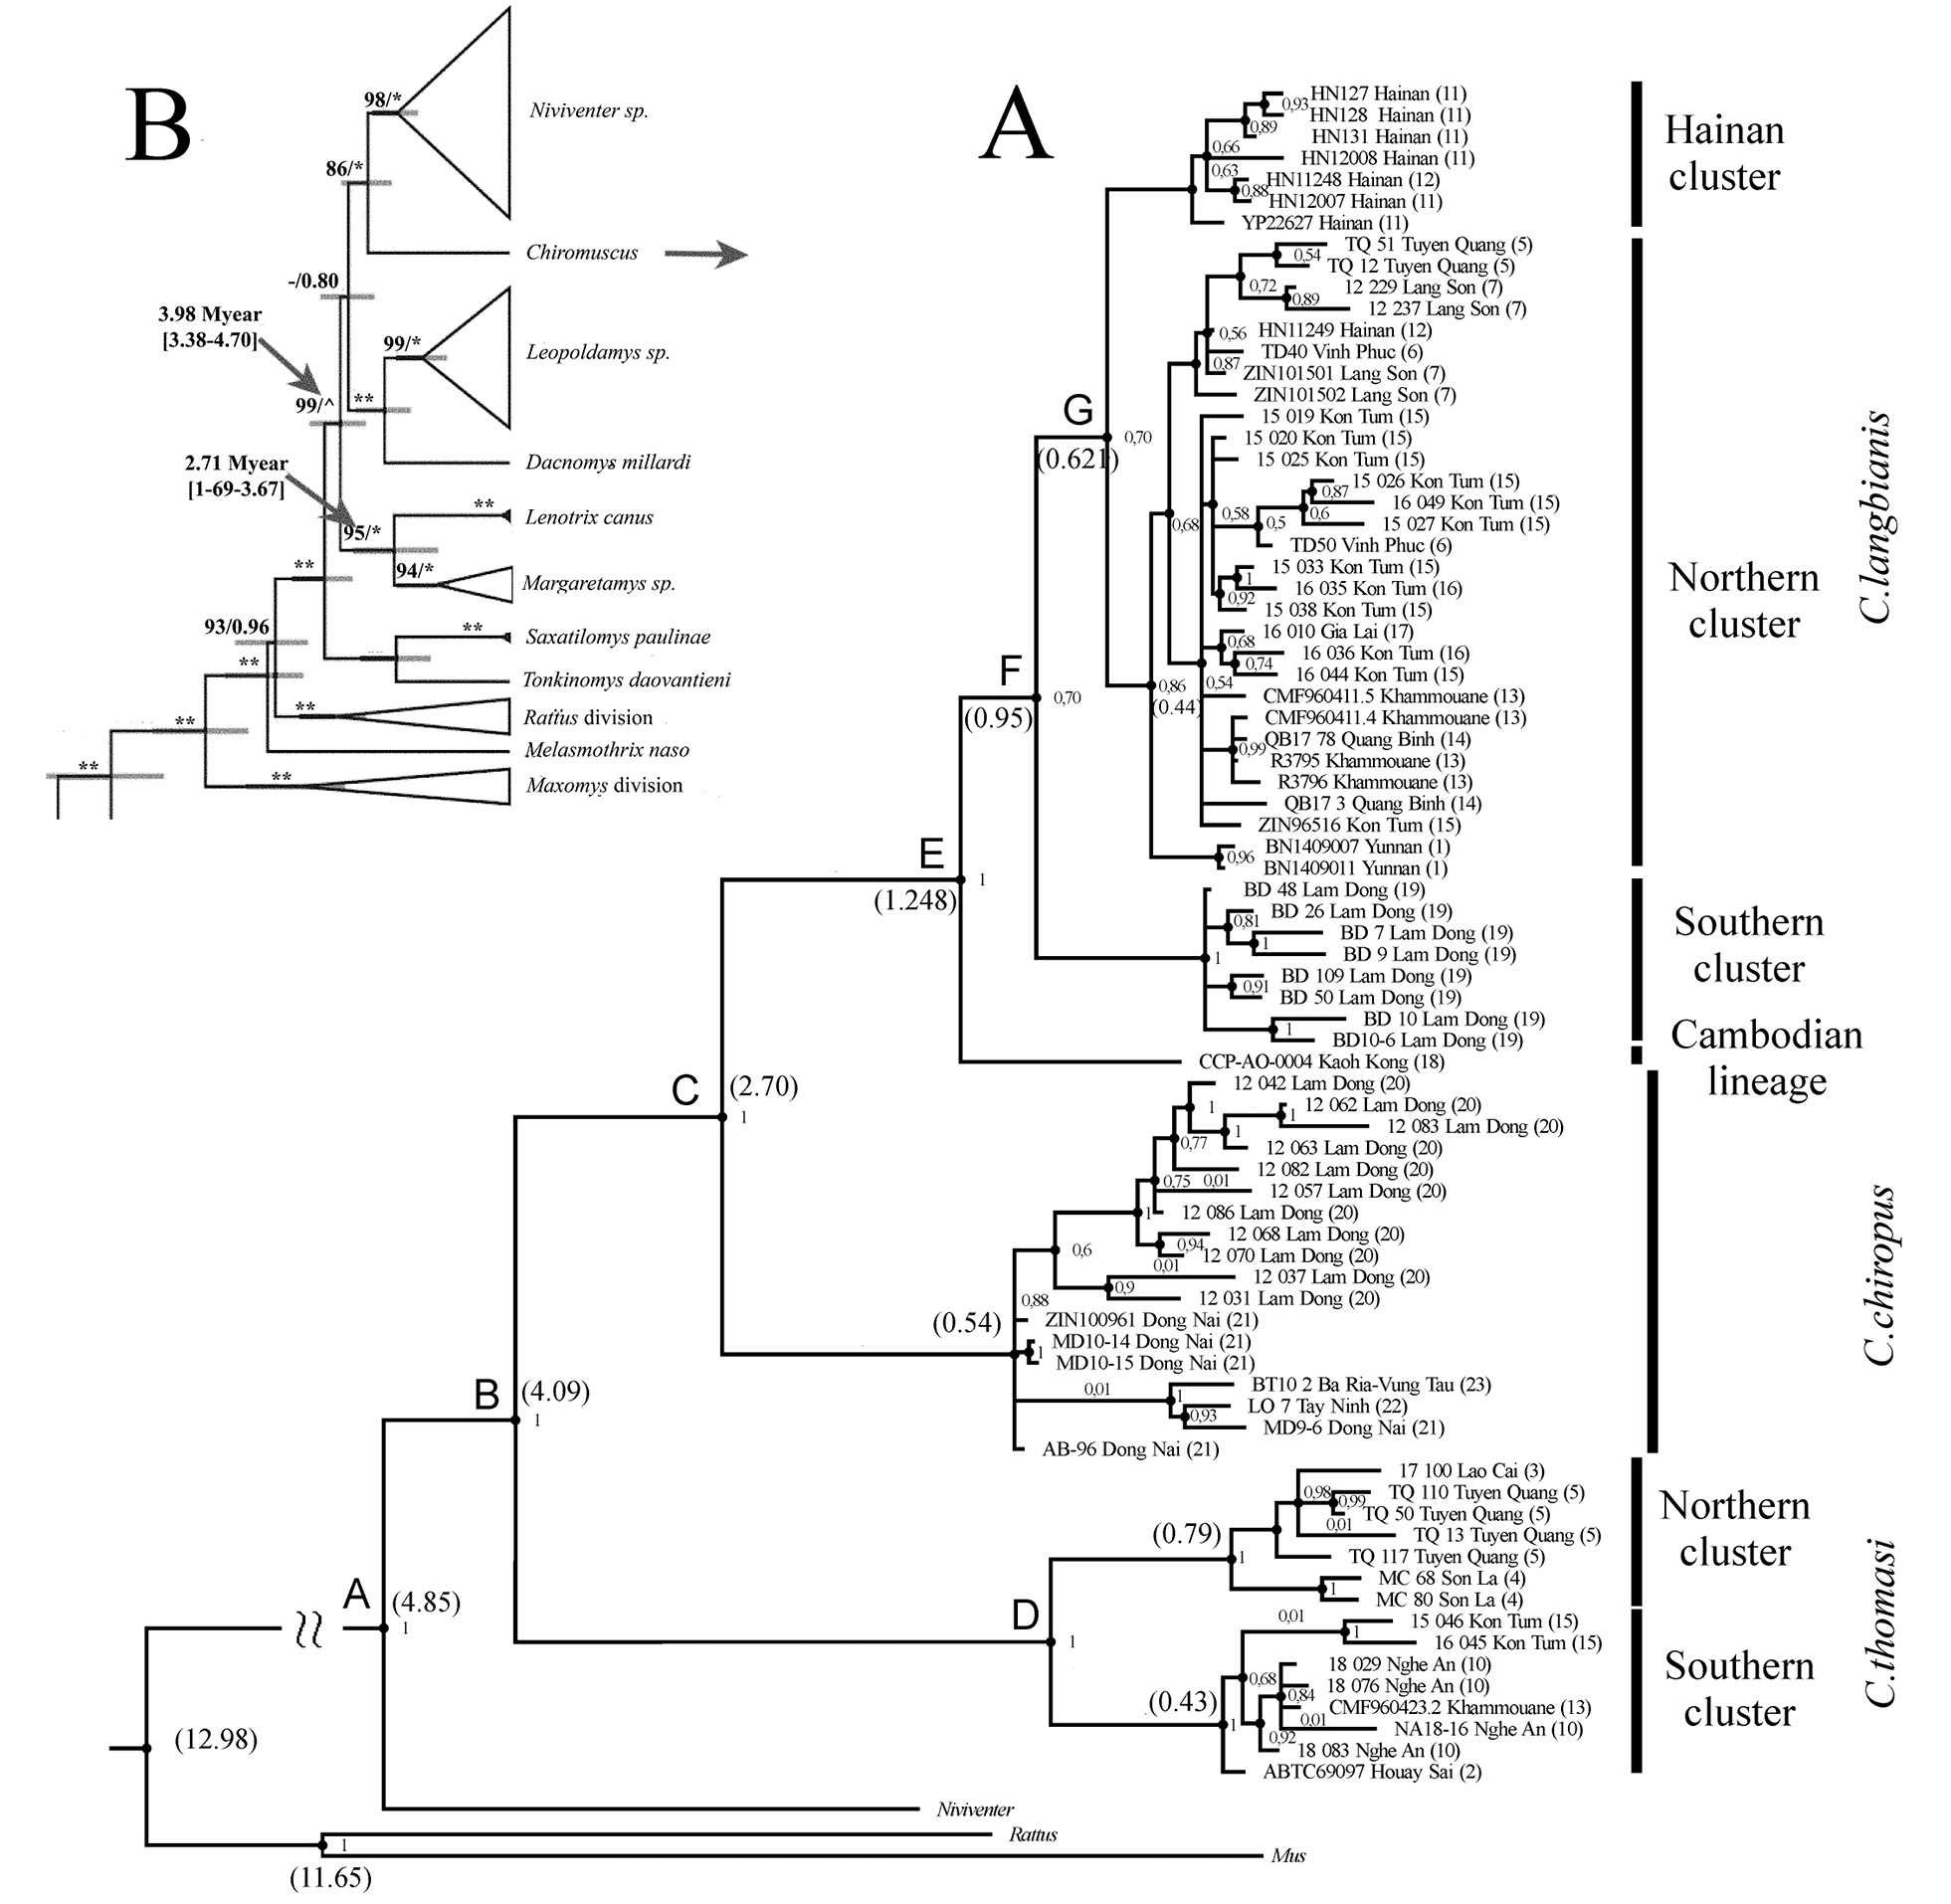
A. The phylogenetic time tree (Cyt b/COI/RAG1/GHR/IRBP genes, concatenated analyses Bayesian inference) for Chiromyscus genetic lineages radiation. The posterior probability values and average divergence time (Mya, in brackets) are presented at the nodes. Branches lengths are indicated above the branches. B. The position of Chiromyscus among most closely relative groups of rodents of SE Asia, marked by arrow (see Pages et al. 2016 for details). Footnote: The sample labels and locality numeration are indicated as in Fig. 1 and Suppl. material 1: Table S1. |