|
||
|
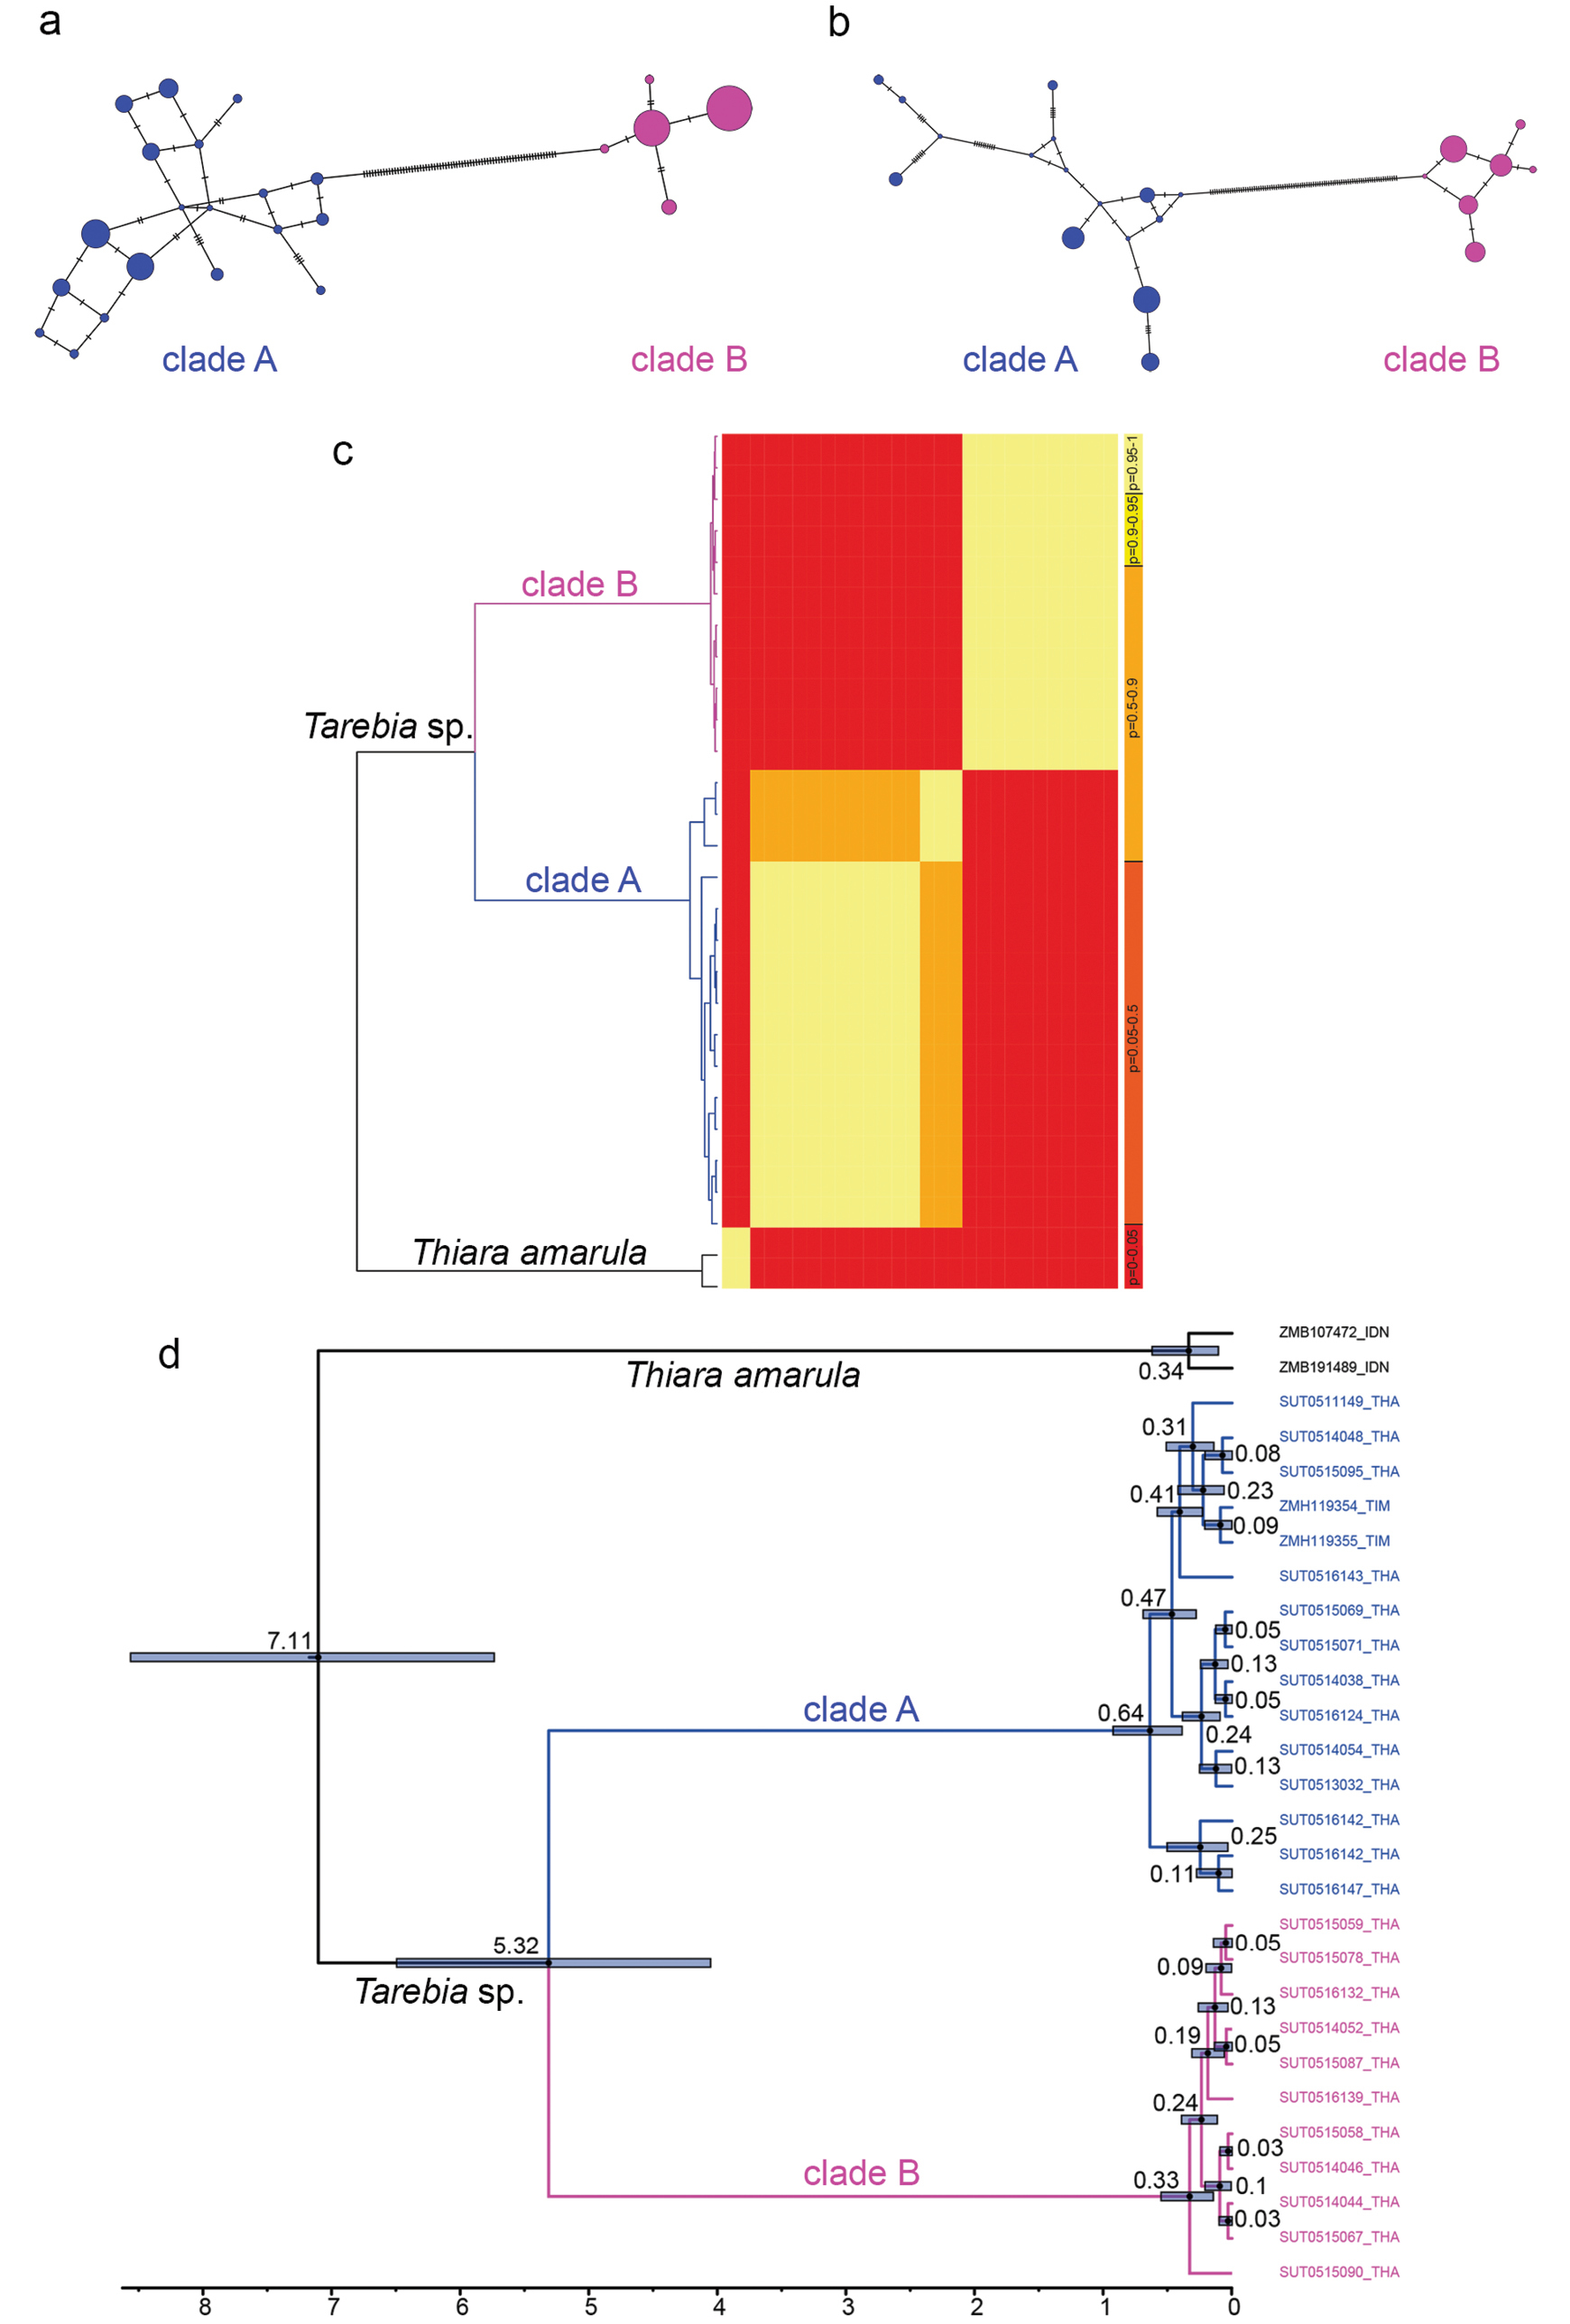
Molecular analysis of Tarebia. a–b. Median-joining haplotype networks based on 16S (a) and cox1 (b) sequence data of Tarebia granifera (Lamarck, 1816). The size of each circle represents the frequency of a haplotype and the colour refers to main mitochondrial clades obtained from the phylogenetic analyses (Fig. 4; blue: clade A, magenta: clade B). Tick marks between circles represent evolutionary steps. c. Results of the bGMYC analysis. Colouration of the matrix cells represents pairwise probabilities of conspecificity. d. Dated molecular tree (only unique haplotypes were included). Numbers at the nodes are node ages in Ma, bars represent 95% highest posterior probabilitiy intervals. |