|
||
|
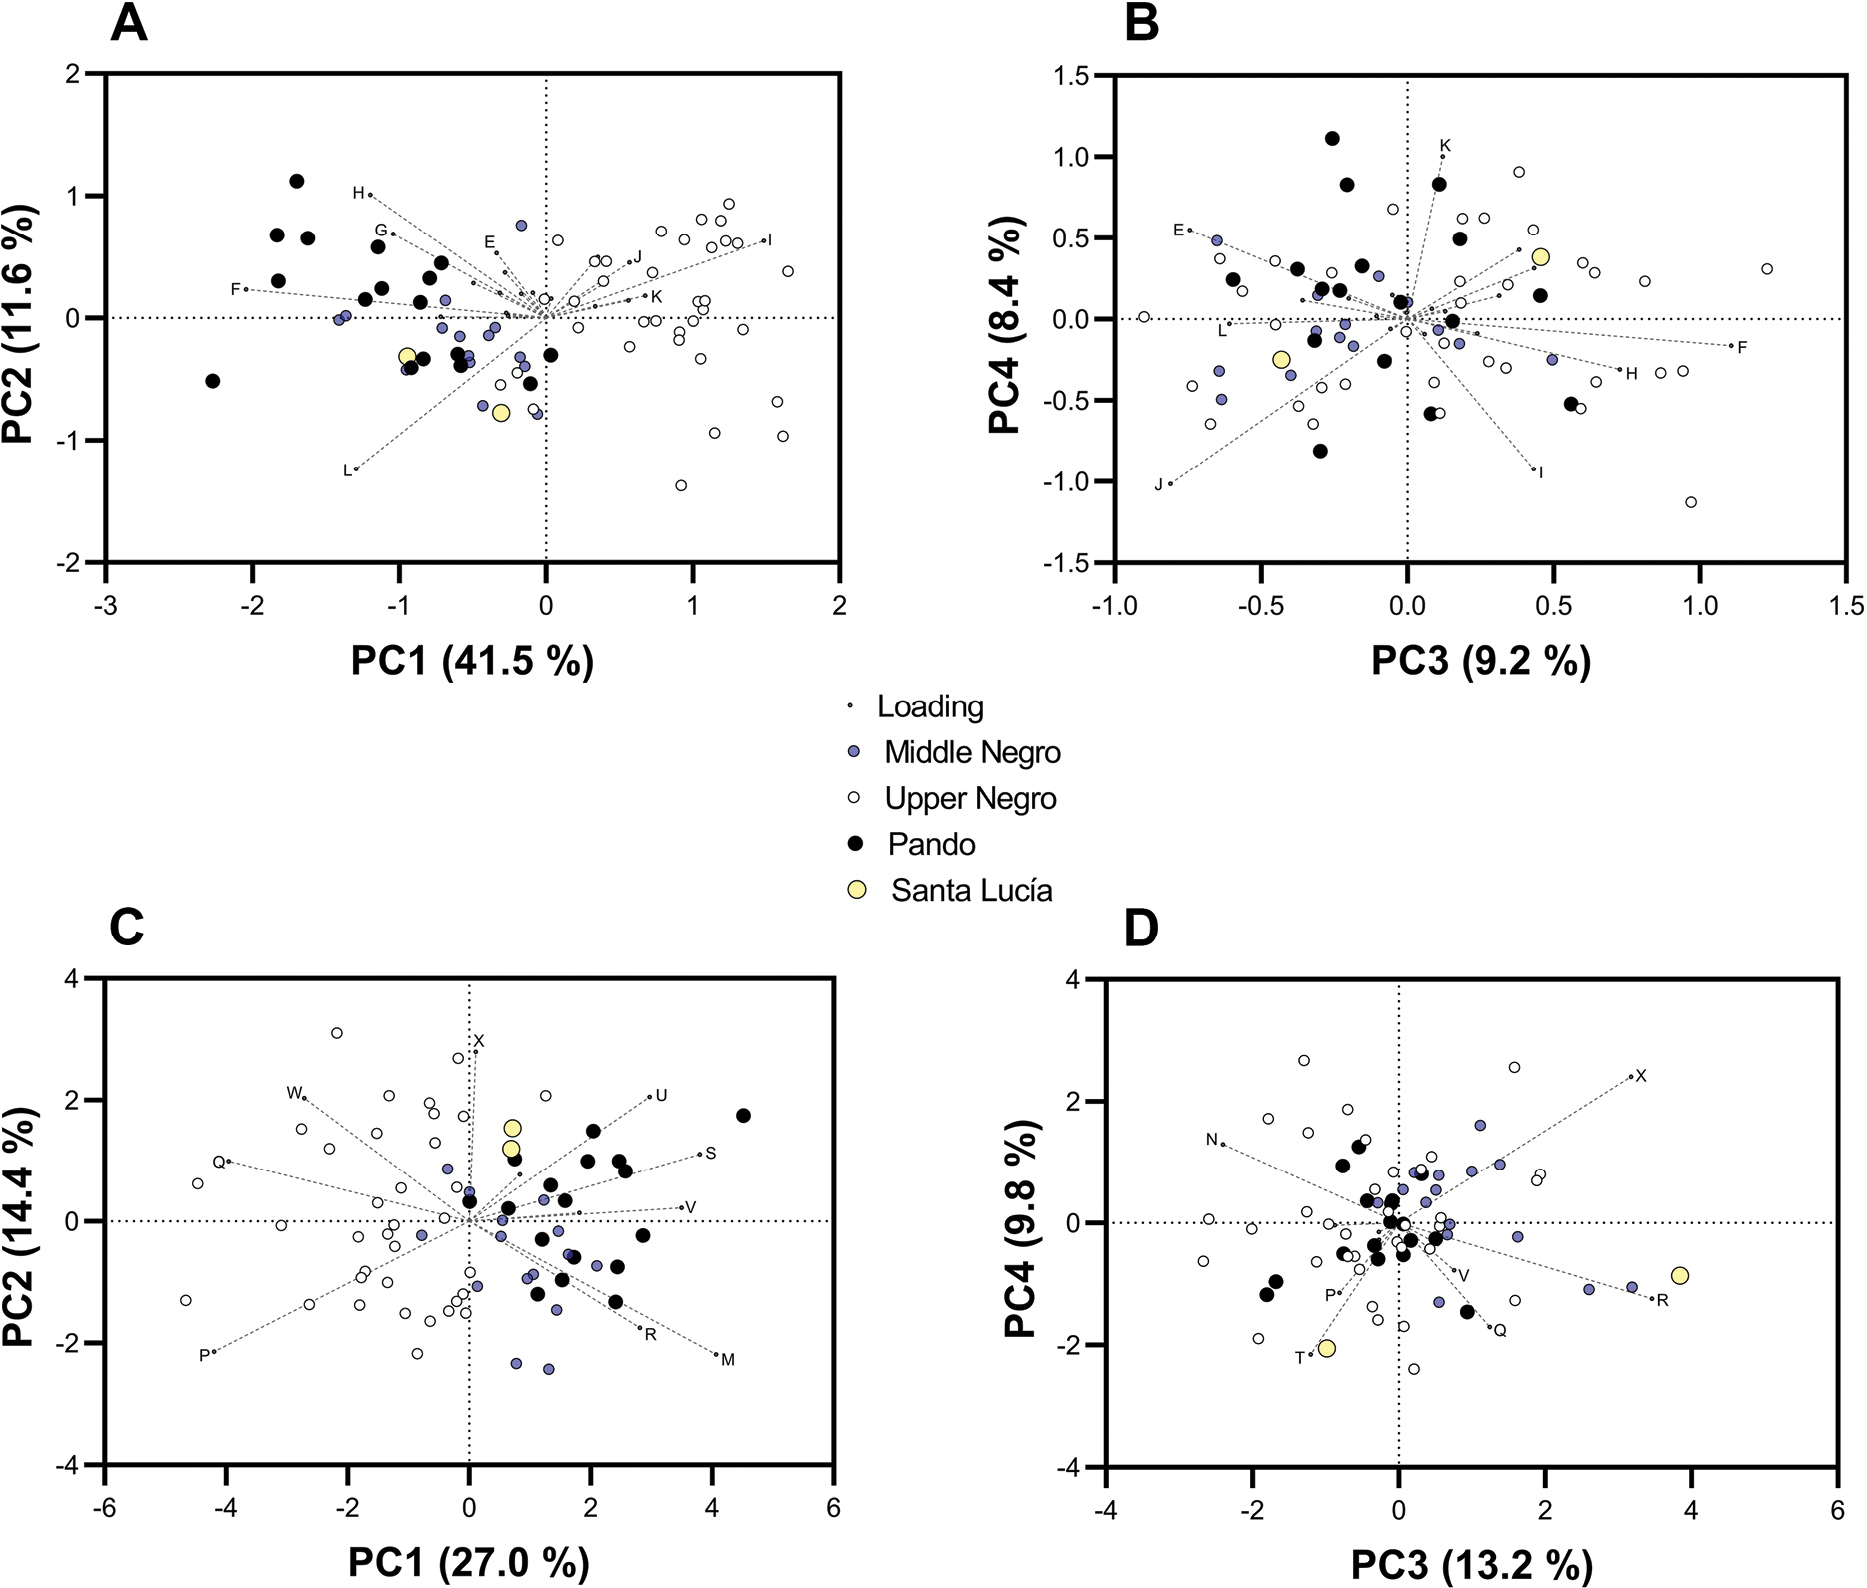
Most discriminant axes obtained from the PCA analyses performed using morphometric and meristic data of studied specimens of Diapoma pampeana (in each plot, the loadings are scaled to 90% of the PC scores). Size-corrected measurements: A. PC1 vs. PC2 plot; B. PC3 vs. PC4 plot. Meristic data; C. PC1 vs. PC2 plot; D. PC3 vs. PC4 plot. Only these variables that most loaded the components are indicated as follows: E- depth at dorsal-fin origin; F- snout to dorsal-fin origin; G- snout to pelvic-fin origin; H- Snout to anal-fin origin; I- distance between dorsal- and adipose-fin origins; J- dorsal fin to caudal-fin base; K- anal-fin base length; L- caudal peduncle length; M- longitudinal scales; N- lateral-line scales; P- scales between lateral line-dorsal origin; Q- scales between lateral line-pelvic origin; R- circumpeduncular scales; S- predorsal scales; T- number of branched anal-fin rays; U- gill rakers on upper limb of branchial arch; V- gill rakers on lower limb of branchial arch; W- number of maxillary teeth; X- number of dentary teeth. |