|
||
|
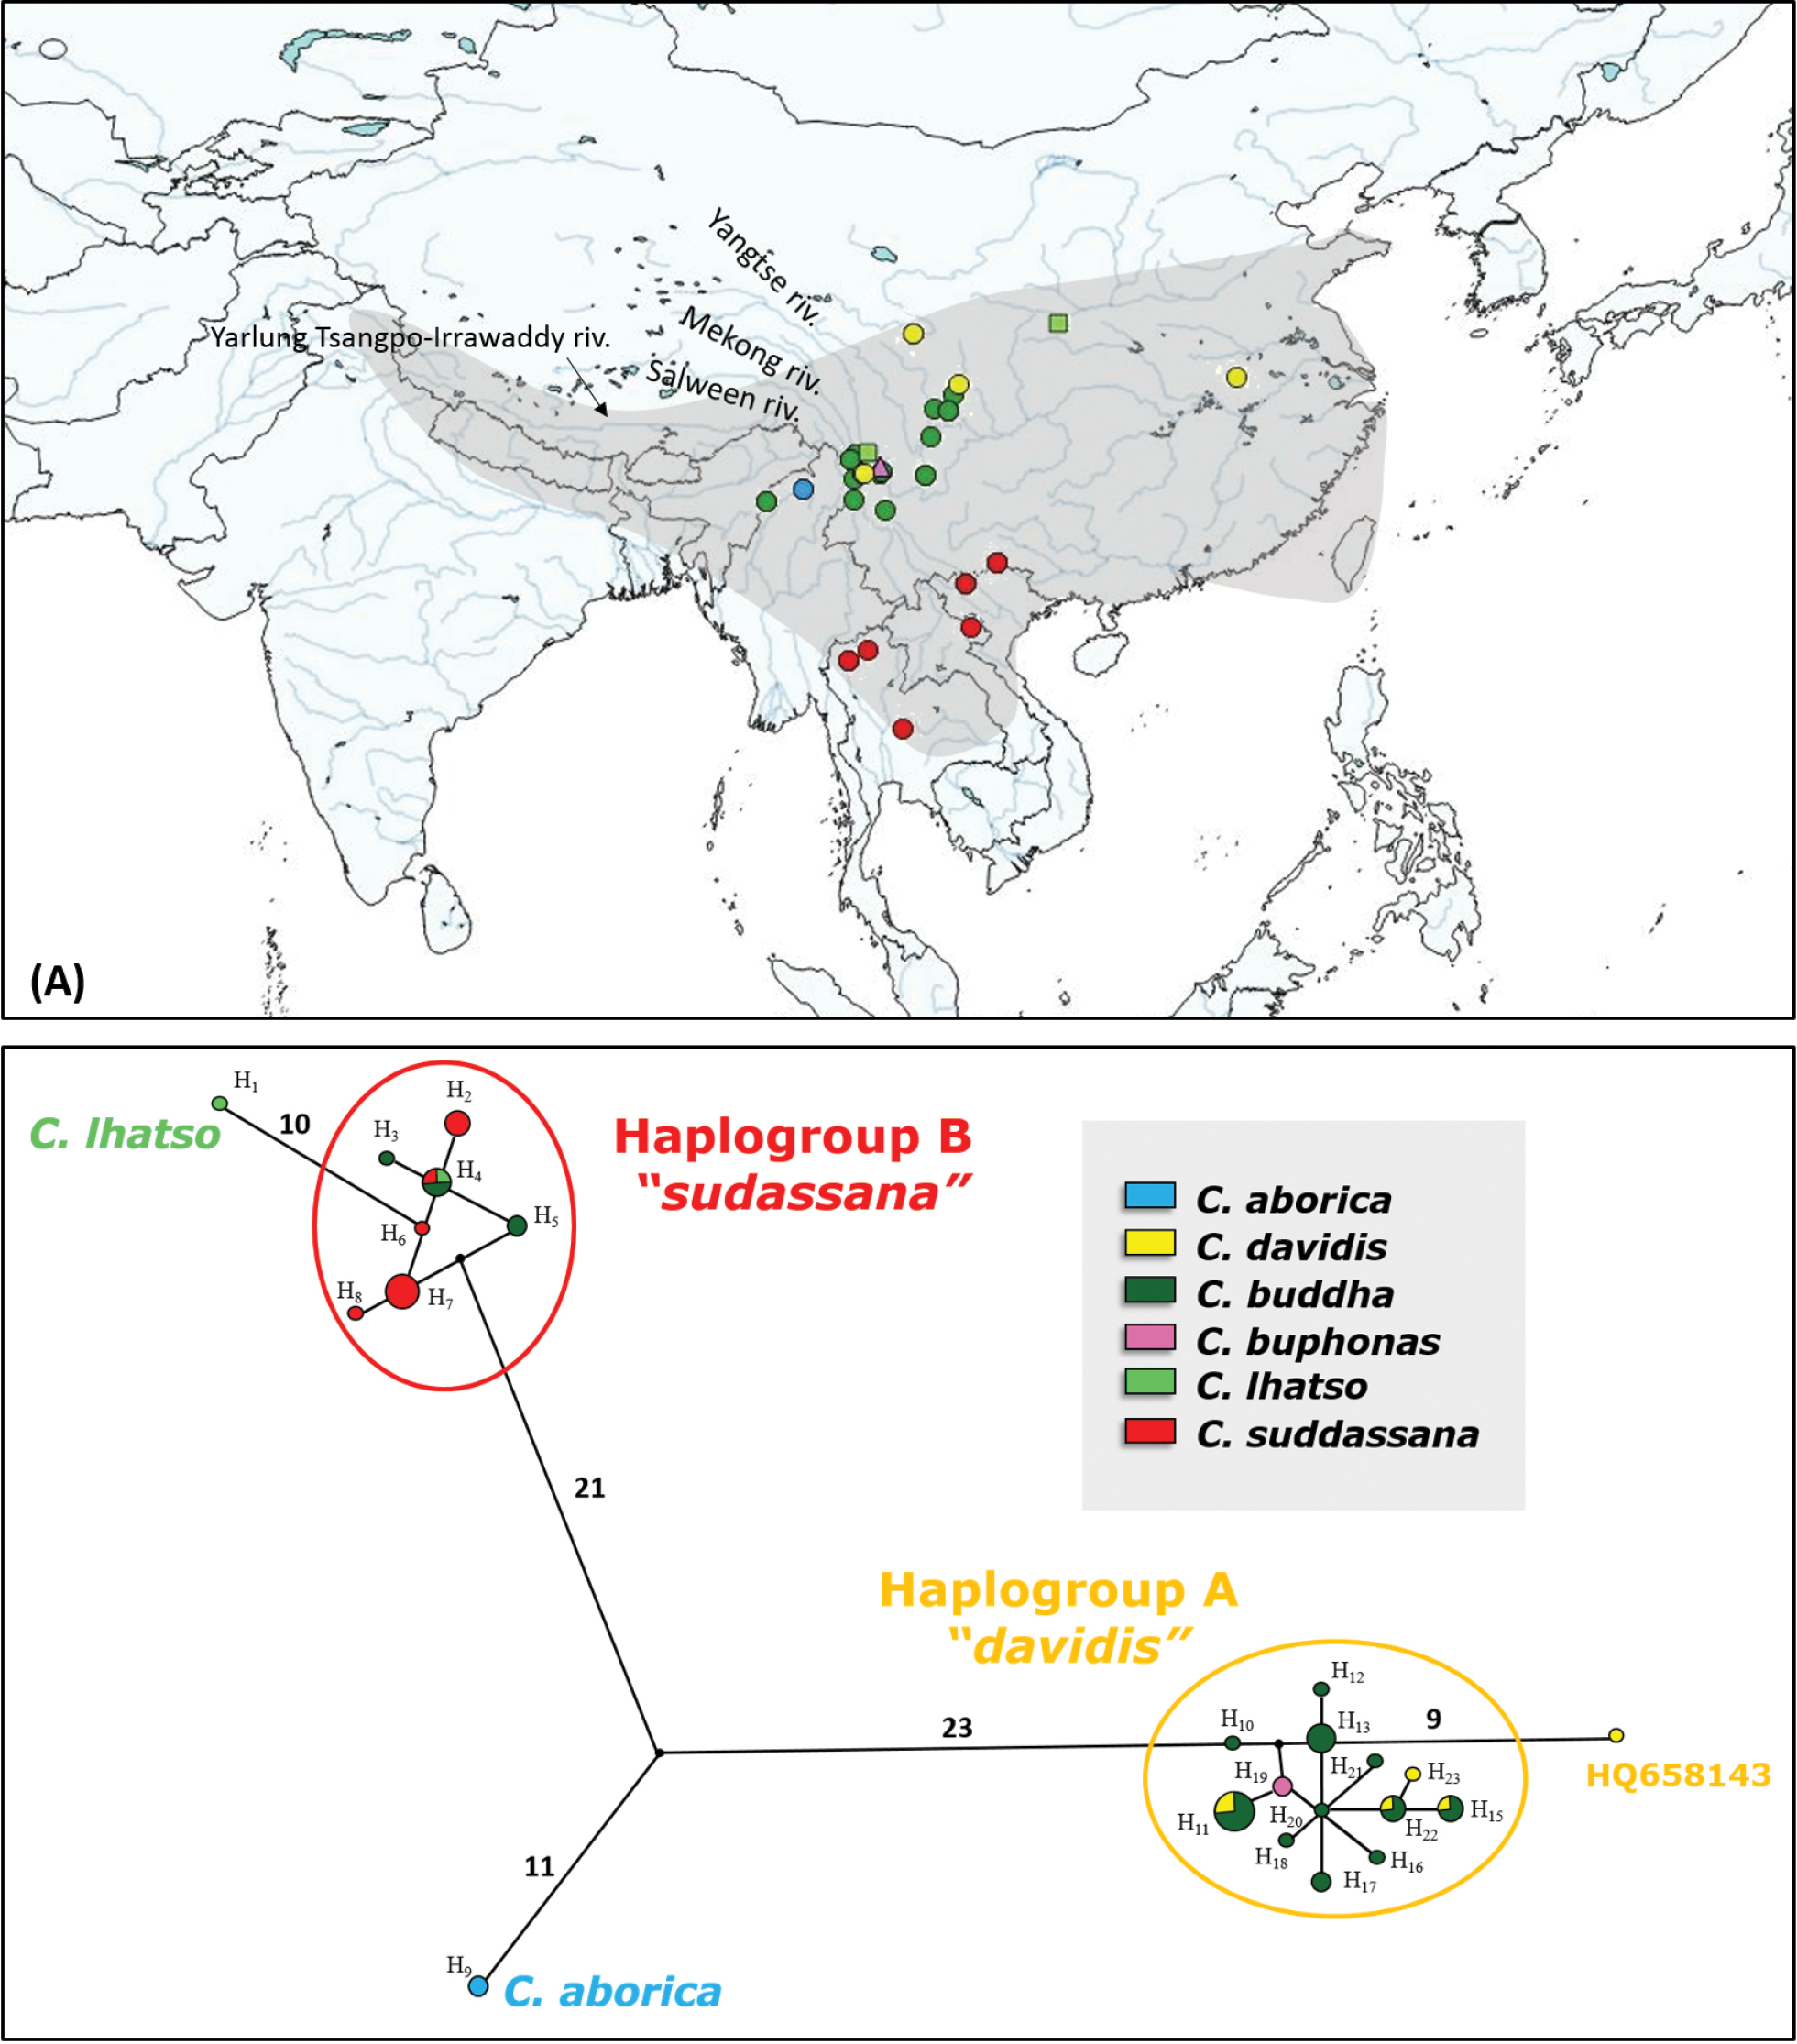
(A) Approximate geographic distributions (Shirôzu 1960, Lang 2012) and sampling localities (circles) for the species of Calinaga included in this study (with the exception of the sample CBUD-INDIN for which we do not have an exact locality). Species as initially identified are highlighted and shown in different colours. Note that many of these initially attributed names subsequently proved erroneous. The map was obtained using Quantum GIS 2.8.2 based on a map from Natural Earth (www.naturalearthdata.com). (B) Median-Joining Network of mtDNA. Circle size proportional to haplotype frequency; number of nucleotide substitutions indicated along connections, except for single or double substitutions. In both figures the species are highlighted and shown in different colours as initially identified. |